Increase was Minor Compared with Large Decreases in September and October
Washington – Trucking activity in the United States increased slightly in November, but volumes remained at low levels. Specifically, truck freight tonnage rose 0.2% after falling 1.9% in October and 0.8% in September, according to the American Trucking Associations’ advanced seasonally adjusted For-Hire Truck Tonnage Index.
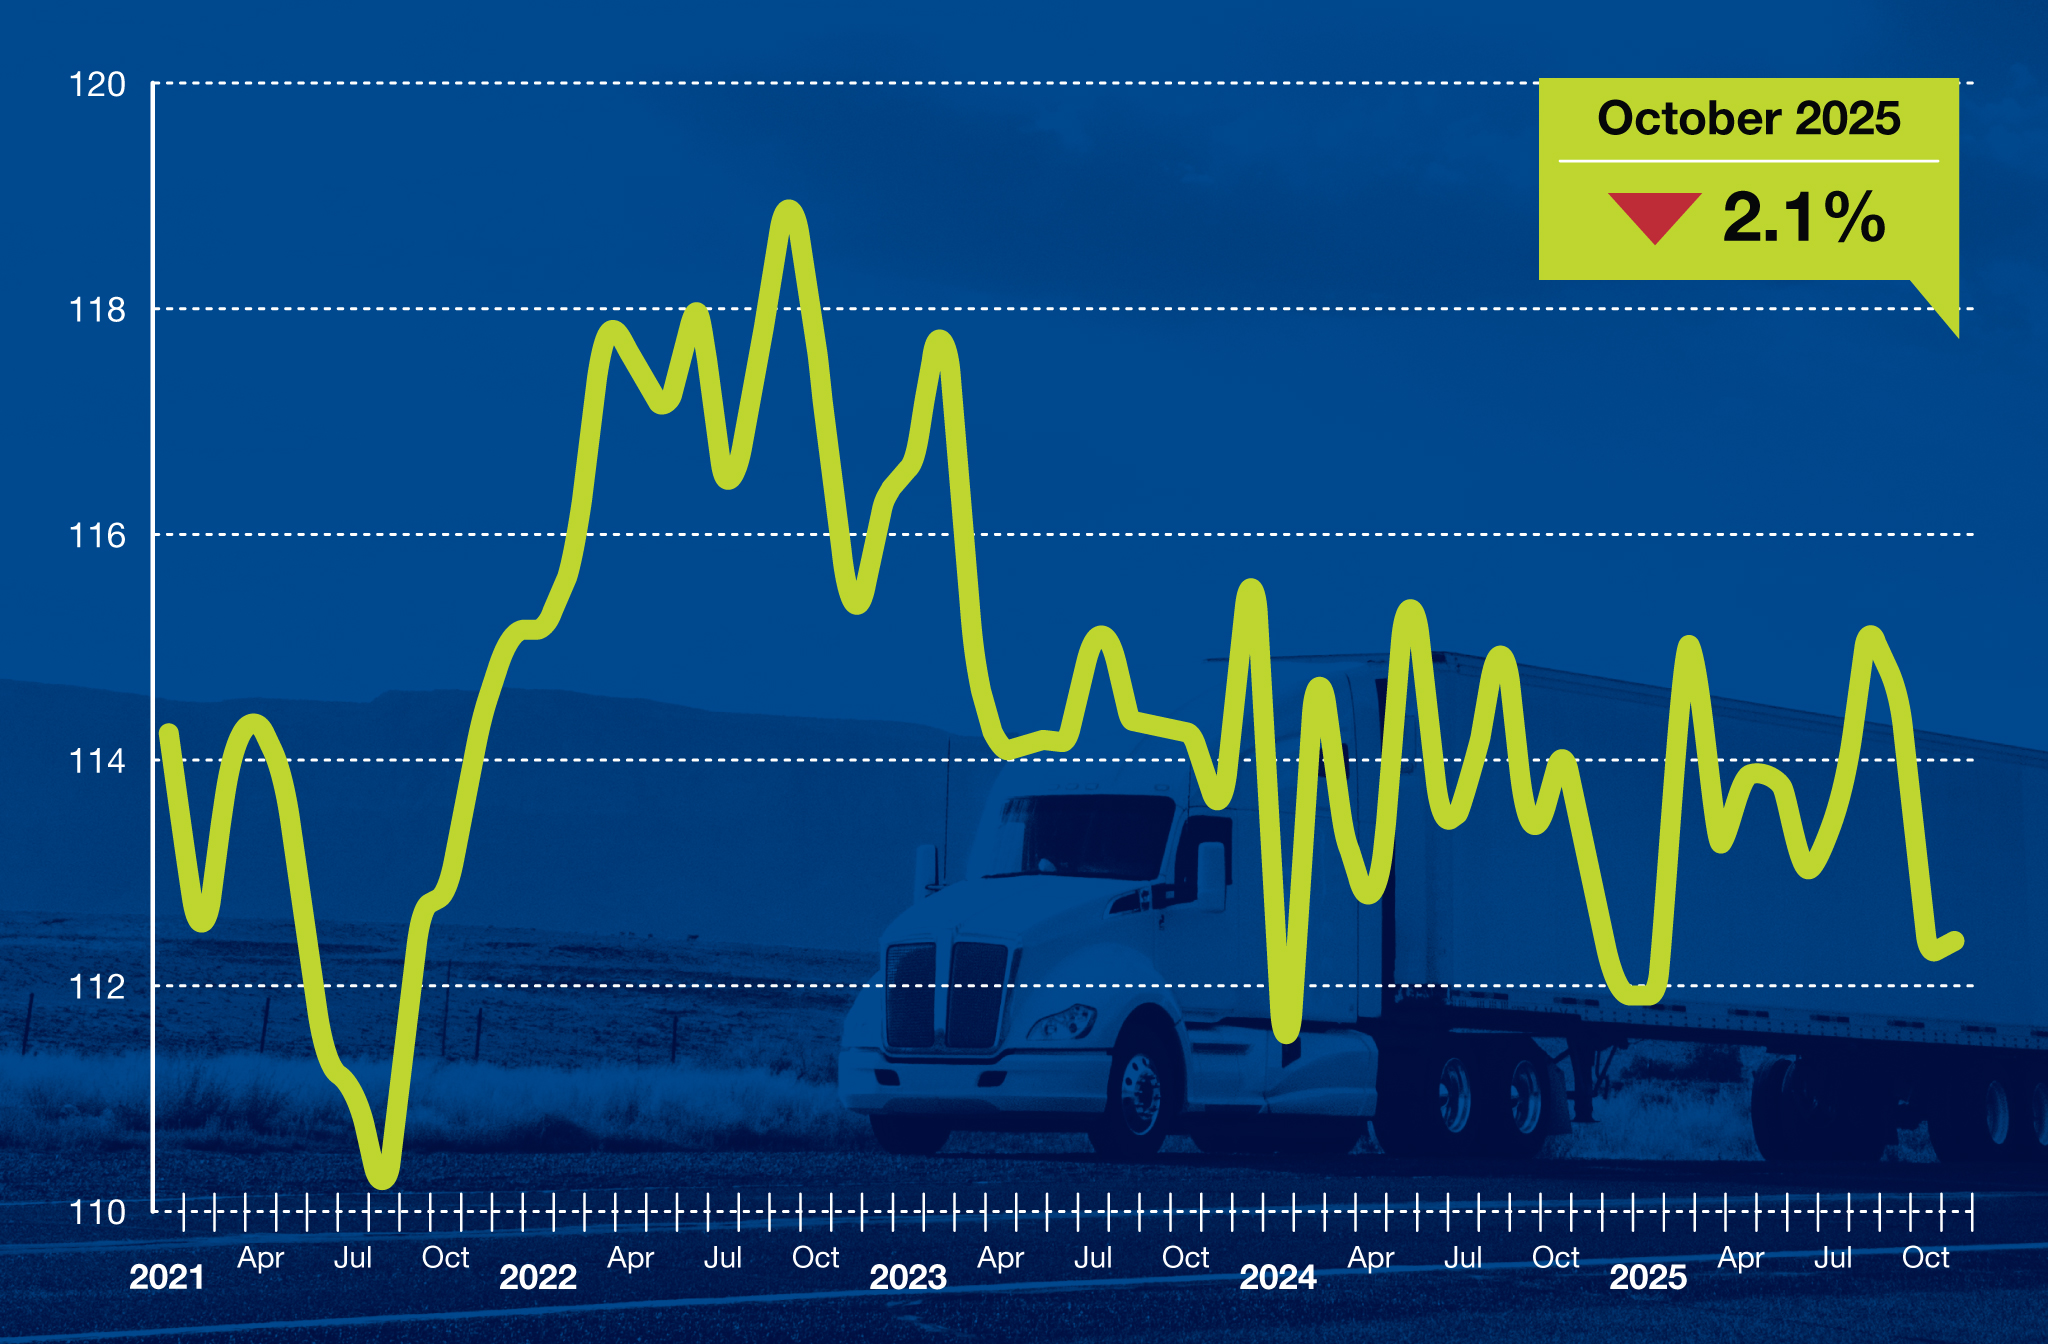
“November’s tonnage reading continues to point to a constrained freight market despite the small sequential increase,” said ATA Chief Economist Bob Costello. “The index was also down from a year earlier, the second straight year-over-year decline. In addition to challenging volumes, more capacity appears to be leaving the industry after a prolonged freight downturn and increased government enforcement measures targeting unqualified drivers and noncompliant carriers.”
In November, the ATA advanced seasonally adjusted For-Hire Truck Tonnage Index equaled 112.4, up from 112.2 in October. The index, which is based on 2015 as 100, contracted 0.3% from the same month last year after decreasing 1.5% in October. Year-to-date, compared with the same period in 2024, tonnage was unchanged.
October’s SA decrease was revised up slightly from what was first reported in our November 18 press release.
The not seasonally adjusted index, which calculates raw changes in tonnage hauled, equaled 107.3 in November, 10.2% below October’s reading of 119.5.
Trucking serves as a barometer of the U.S. economy, representing 72.7% of tonnage carried by all modes of domestic freight transportation, including manufactured and retail goods. Trucks hauled 11.27 billion tons of freight in 2024. Motor carriers collected $906 billion, or 76.9% of total revenue earned by all transport modes.
Both indices are dominated by contract freight, as opposed to traditional spot market freight. The tonnage index is calculated on surveys from its membership and has been doing so since the 1970s. This is a preliminary figure and subject to change in the final report issued around the 5th day of each month. The report includes month-to-month and year-over-year results, relevant economic comparisons, and key financial indicators.
* 2024 estimates include forecasts.