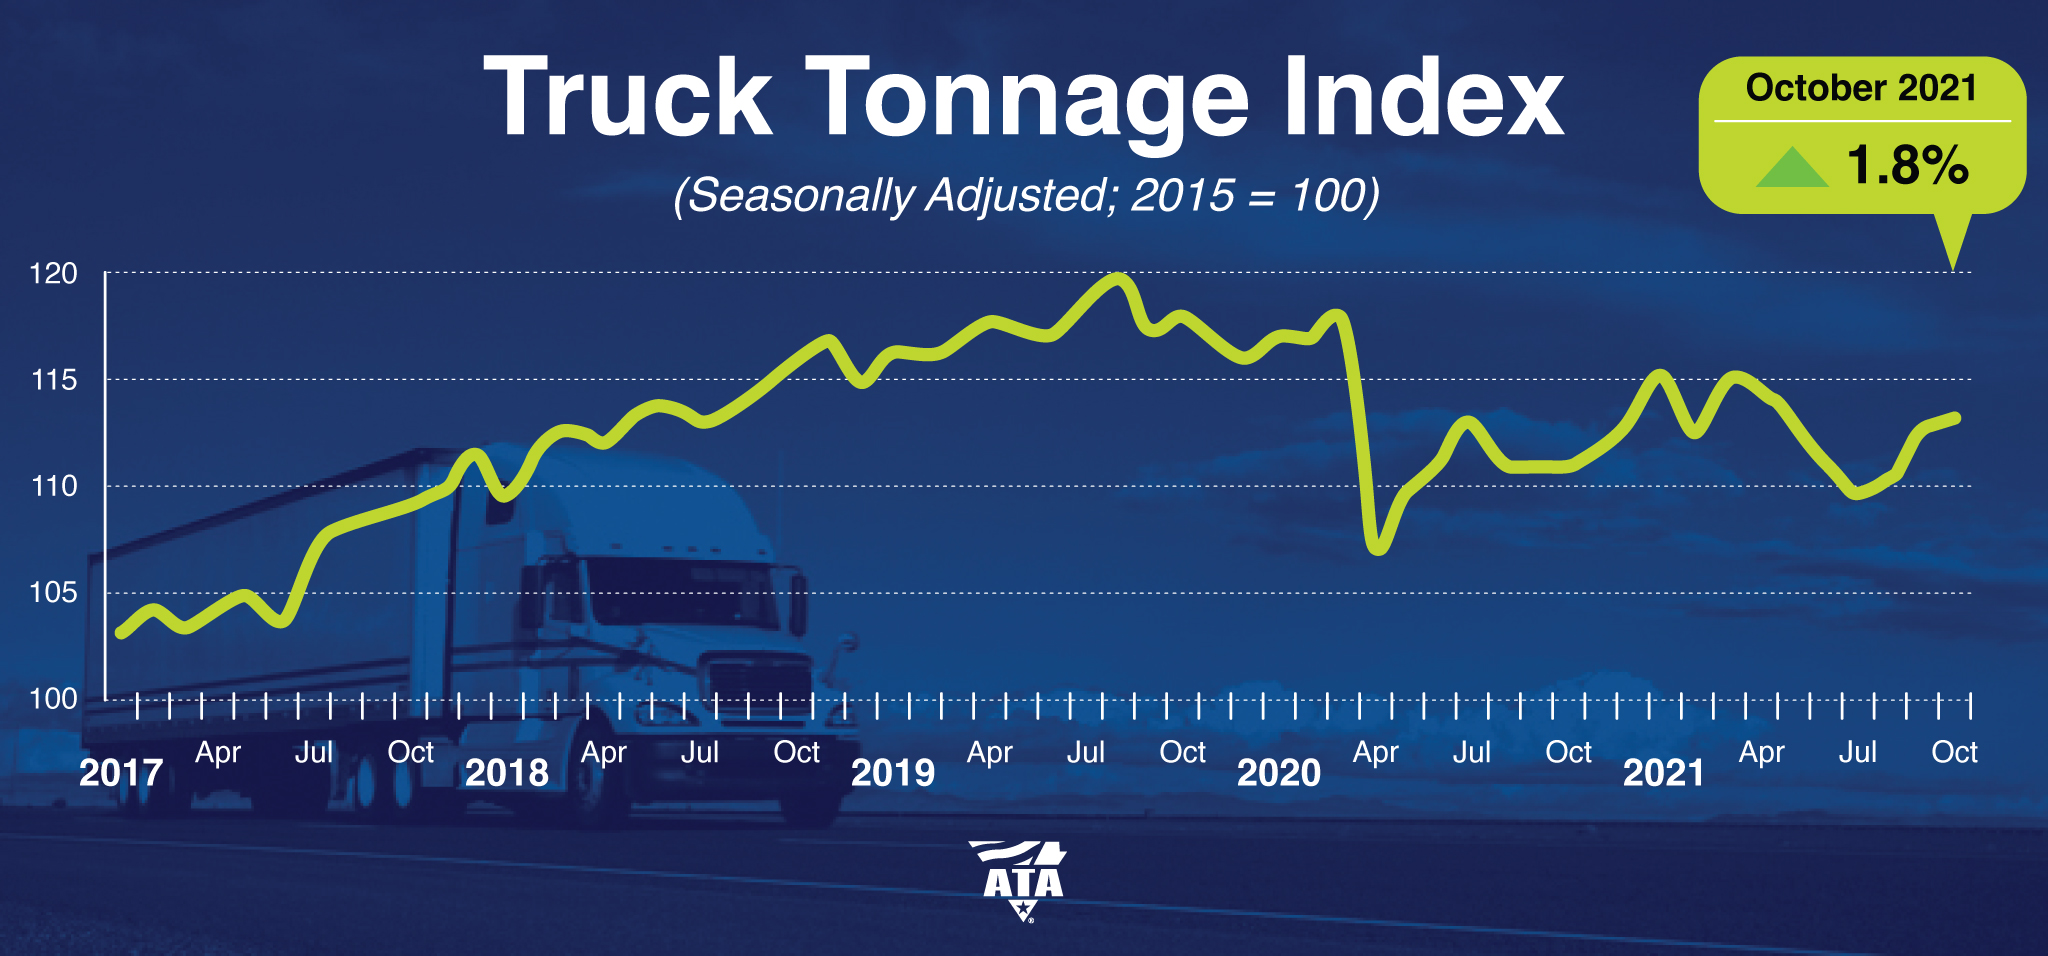
Index 1.8% Above October 2020
Arlington, Virginia — American Trucking Associations’ advanced seasonally adjusted (SA) For-Hire Truck Tonnage Index increased 0.4% in October after rising 2.2% in September. In October, the index equaled 113 (2015=100) compared with 112.6 in September.
“October’s gain was the third straight totaling 2.9%,” said ATA Chief Economist Bob Costello. “The combination of solid retail sales, inventory rebuilding, and generally higher factory output offset some areas of softer freight growth, like home construction, in October.
“Economic growth remains on solid footing, which is good for truck freight volumes going forward. The largest problem for the industry isn’t the amount of demand, but making sure we have adequate supply. It is good to see that fleets were able to haul more tonnage in recent months in the face of constrained supply,” he said.
September’s reading was revised down slightly to 2.2% from our October 19 press release.
Compared with October 2020, the SA index rose 1.8%, which was the largest year-over-year gain since May. In September, the index was up 1.4% from a year earlier. Year-to-date, compared with the same ten months in 2020, tonnage is up 0.1%.
The not seasonally adjusted index, which represents the change in tonnage actually hauled by the fleets before any seasonal adjustment, equaled 115.8 in October, 2.6% above the September level (112.9). In calculating the index, 100 represents 2015. ATA’s For-Hire Truck Tonnage Index is dominated by contract freight as opposed to spot market freight.
Trucking serves as a barometer of the U.S. economy, representing 72.5% of tonnage carried by all modes of domestic freight transportation, including manufactured and retail goods. Trucks hauled 11.84 billion tons of freight in 2019. Motor carriers collected $791.7 billion, or 80.4% of total revenue earned by all transport modes.
ATA calculates the tonnage index based on surveys from its membership and has been doing so since the 1970s. This is a preliminary figure and subject to change in the final report issued around the 5th day of each month. The report includes month-to-month and year-over-year results, relevant economic comparisons, and key financial indicators.