Tonnage was off 0.1% from June 2024
Washington — Trucking activity in the United States slipped in June as the freight market eroded during the last two months of the second quarter. Specifically, truck freight tonnage decreased 0.4% after falling 0.1% in May, according to the American Trucking Associations’ advanced seasonally adjusted For-Hire Truck Tonnage Index.
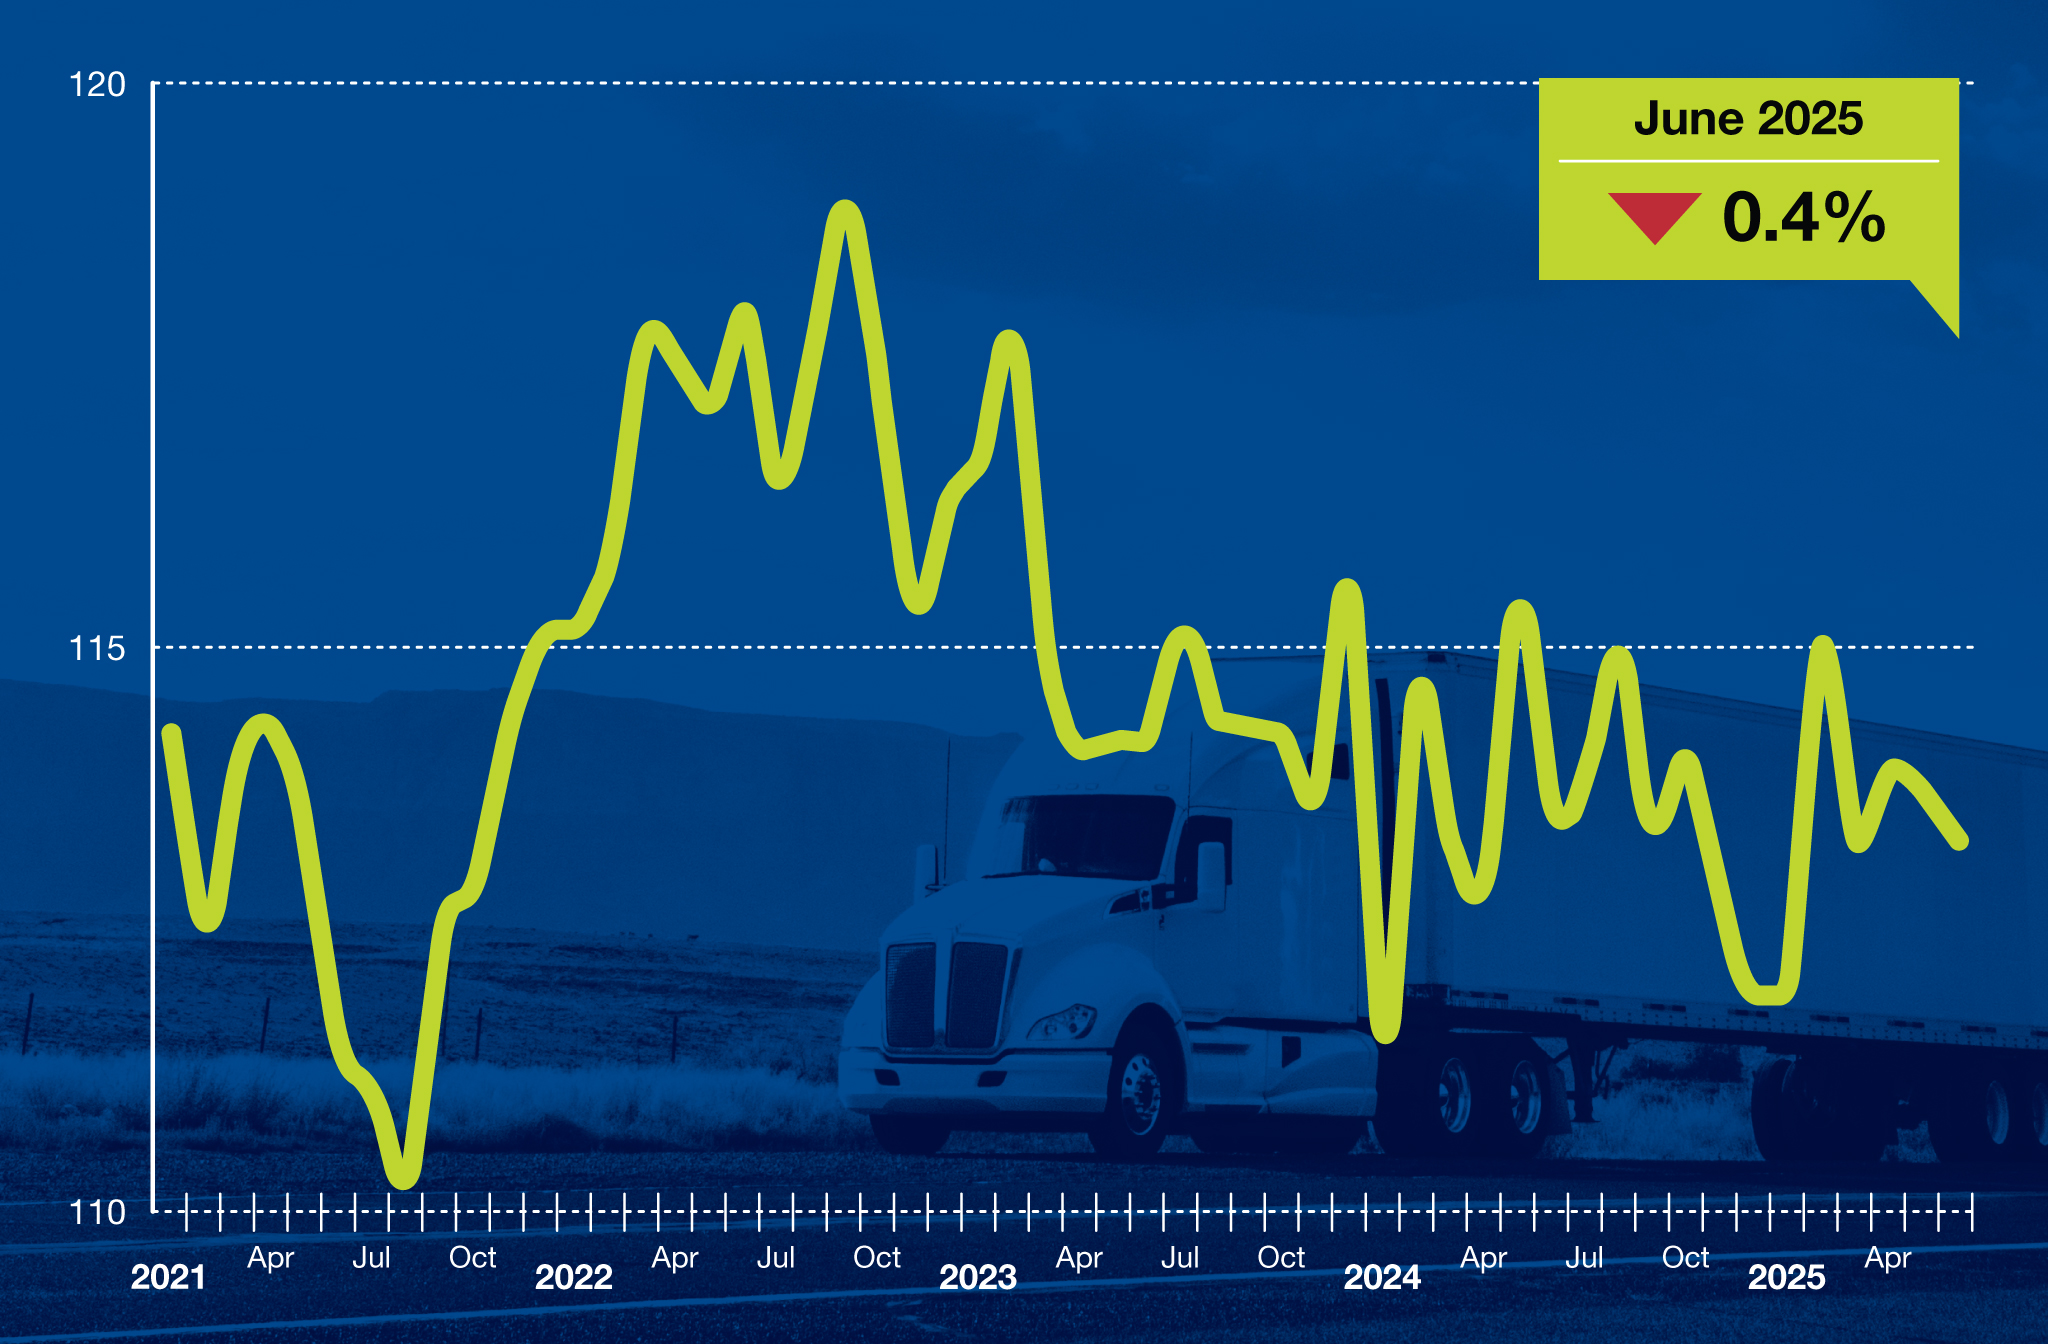
“After a strong start to the second quarter, with tonnage levels increasing sequentially and from a year earlier in April, freight levels eased in May and June,” said ATA Chief Economist Bob Costello. “In the second quarter, truck tonnage was essentially flat, increasing 0.2% from the first quarter, but falling 0.2% from a year earlier. Freight levels have been helped recently by small gains in factory output and retail sales, but weaker construction activity, especially for single-family homes, has been a drag on volumes.”
In June, the ATA advanced seasonally adjusted For-Hire Truck Tonnage Index equaled 113.3, down from 113.8 in May. The index, which is based on 2015 as 100, slipped 0.1% from the same month last year after falling 1.3% in May. Year-to-date, compared with the same period in 2024, tonnage was up 0.1%.
May’s SA decline was unchanged from our June 24, 2025 press release.
The not seasonally adjusted index, which calculates raw changes in tonnage hauled, equaled 114.9 in June, 1.1% below May’s reading of 116.2.
Trucking serves as a barometer of the U.S. economy, representing 72.7% of tonnage carried by all modes of domestic freight transportation, including manufactured and retail goods. Trucks hauled 11.27 billion tons of freight in 20241. Motor carriers collected $906 billion, or 76.9% of total revenue earned by all transport modes.
Both indices are dominated by contract freight, as opposed to traditional spot market freight. The tonnage index is calculated on surveys from its membership and has been doing so since the 1970s. This is a preliminary figure and subject to change in the final report issued around the 5th day of each month. The report includes month-to-month and year-over-year results, relevant economic comparisons, and key financial indicators.